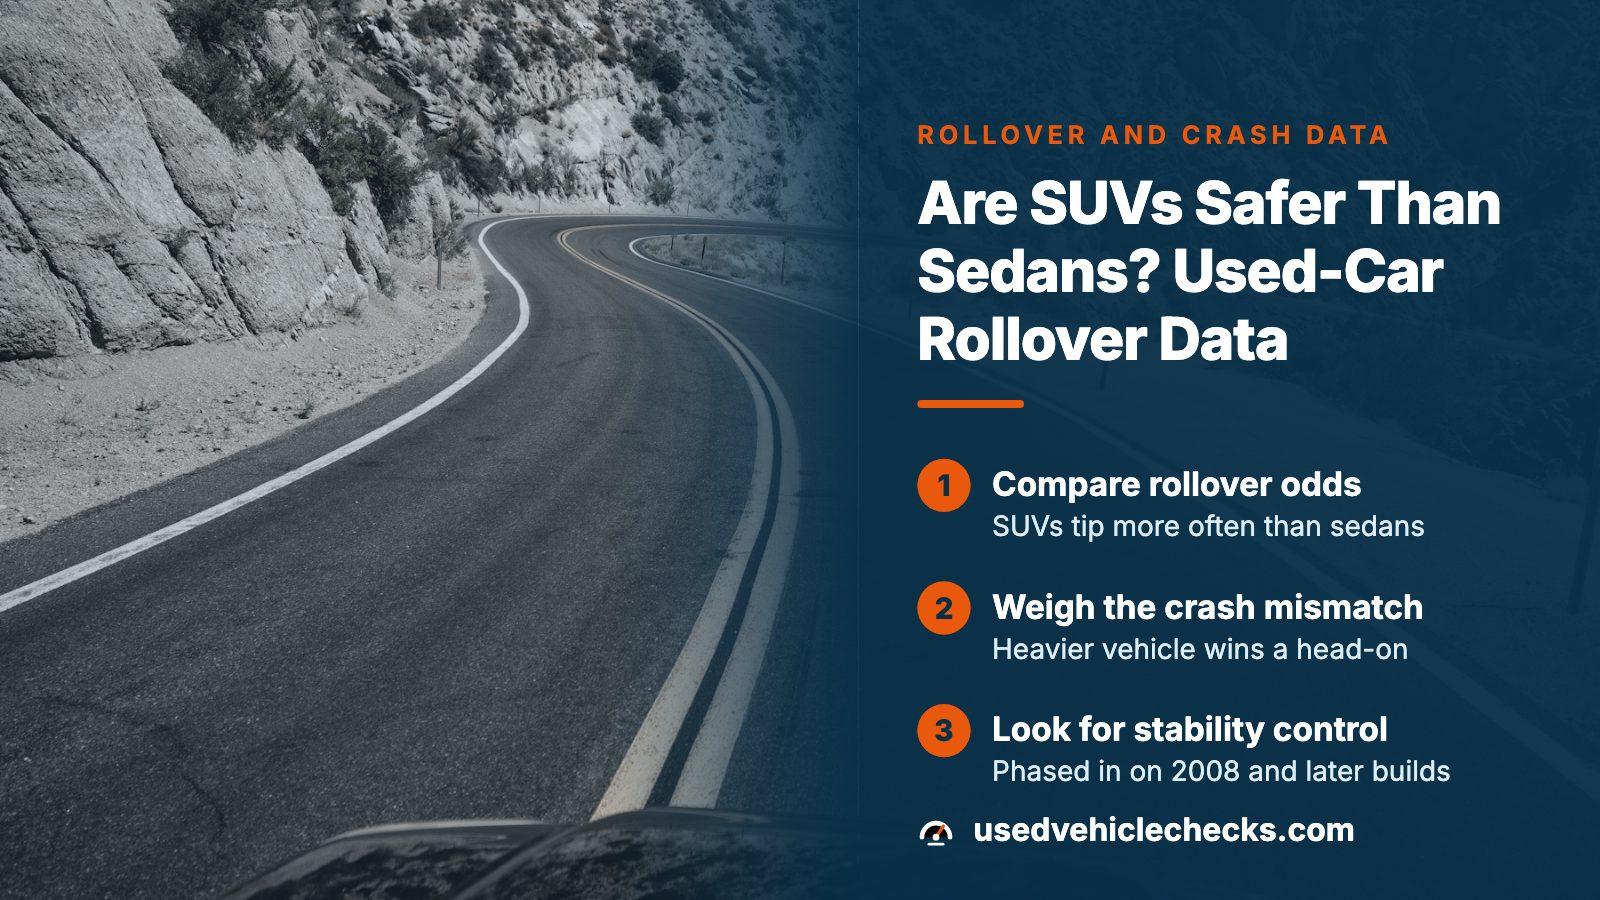
THE SHORT ANSWER
Not on rollover. In the NHTSA ratings sample behind this page, SUVs have a median rollover chance of 17.0% and sedans 10.3%. SUVs hold the advantage when two vehicles of unequal weight collide. Neither point describes one particular used car, so compare the exact year, make and model, confirm stability control is fitted, and read the VIN records before you pay.
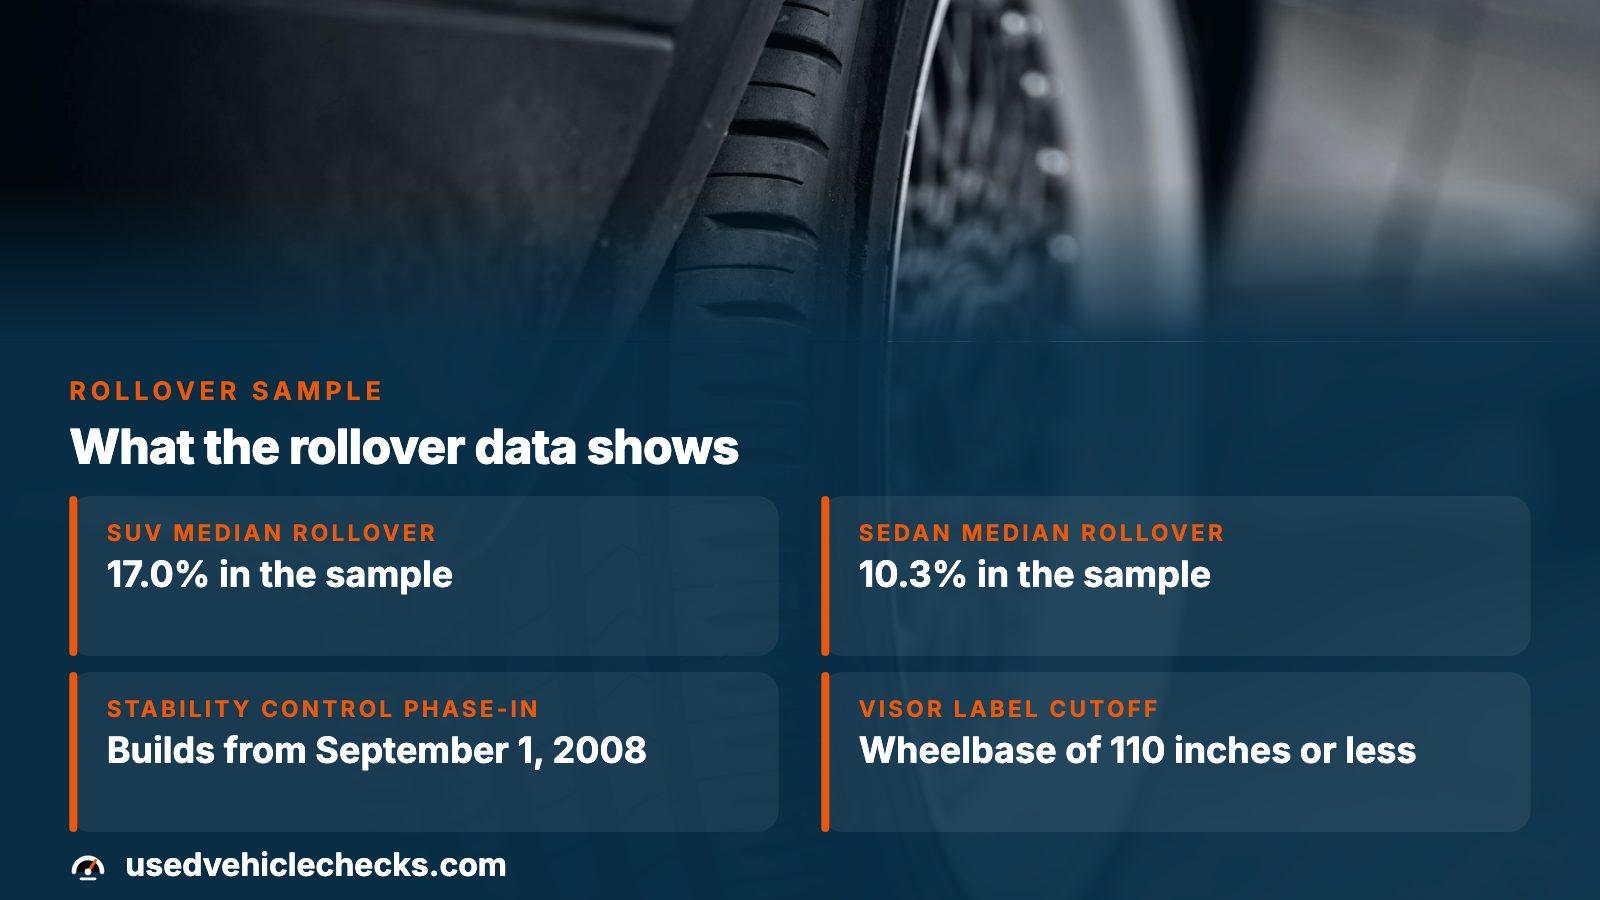
- SUV median rollover chance
- 17.0% in the sample
- Sedan median rollover chance
- 10.3% in the sample
- Stability control phase-in
- Builds from September 1, 2008
- Visor label wheelbase cutoff
- 110 inches or less
Why both sides keep winning the argument
Someone who says SUVs are safer is usually picturing a crash with another car. Someone who says sedans are safer is usually picturing a car that slides off a road and tips. Both pictures are accurate, and neither covers the accident you are most likely to have. A third angle, the harm a vehicle does to whoever it hits, adds more argument and little data. Of the three, only the tipping risk gets a government figure for each vehicle, which makes it the natural place to start.
How often tall vehicles tip, by body type
NHTSA reports rollover twice: as stars, and as the percentage chance of tipping in a crash that involves no other vehicle. The sample here pulls 111 rated configurations from the 5-Star data and groups them by body type, dropping any type with fewer than 5 rows as too thin to summarize.
| Body type | Rows | Lowest | Median | Highest | Stars |
|---|---|---|---|---|---|
| SUV | 56 | 13.5% | 17.0% | 27.9% | 3 and 4 |
| Sedan | 27 | 6.6% | 10.3% | 11.8% | 4 and 5 |
| Pickup | 13 | 14.7% | 19.8% | 29.2% | 3 and 4 |
| Minivan | 5 | 11.6% | 14.0% | 16.4% | 4 |
Read down the Median column and the order is sedan, minivan, SUV, pickup. The SUV median is roughly 65 percent above the sedan median. The groups also do not overlap: the lowest SUV figure is above the highest sedan figure. No SUV in the sample reaches 5 rollover stars, and some stop at 3.
What the numbers leave out
Five limits are worth holding onto before you quote any of this to a seller.
- Tipping in a one-vehicle crash is a single kind of accident. The figure says nothing about deaths overall.
- The rows lean toward mainstream models from the past two decades or so, so read the result as a pattern, not a national count.
- Ratings belong to body configurations. One model can carry several rows, and your trim may sit above or below its family's median.
- Collisions between two vehicles are outside the figure entirely.
- Cars with no rating are absent. Absent means untested, not safe and not dangerous.
Where the heavier vehicle wins, and who benefits
Weight matters most when two vehicles meet. The heavier one keeps more of its momentum, so its occupants are shielded and the people in the lighter vehicle absorb more of the force. That is physics, and the studies comparing small cars with SUVs reflect it. Two things shrink the point. It applies only to a crash with another vehicle, so it does not cancel the tipping risk above. And it is relative: as more of the traffic around you gets heavy, the advantage fades.
Your own roads decide which risk is larger. Long, fast, poorly lit stretches make a lone-vehicle slide a bigger share of what can go wrong. Stop-start city traffic makes multi-car impacts the main event, and crash-avoidance equipment counts for as much as body style.
Stability control arrived in phases, so the build date matters
Federal Motor Vehicle Safety Standard 126, found at 49 CFR 571.126, sets the stability-control requirement. Its purpose clause targets crashes where a driver loses directional control, rollovers among them, and it covers light vehicles up to 10,000 pounds. The rule came in on a schedule.
- Built on or after September 1, 2008: stability control on at least 55 percent of a maker's covered production.
- Built on or after September 1, 2009: that share rises to 75 percent.
- As of September 1, 2011: the driver-facing telltale requirements take effect.
Stability control lowers rollover risk; it does not lower the vehicle. For a tall vehicle built between those dates, confirm the system is on that particular car, because a model year by itself proves nothing about the equipment.
The warning label tucked behind the sun visor
Some utility vehicles carry a federally required rollover warning on the driver's sun visor (49 CFR 575.105). It uses a yellow header with black lettering and an alert symbol over a white message panel, and the message is that these vehicles are more likely to roll over than other vehicle types.
The rule covers a defined group: multipurpose vehicles that are not passenger-car derivatives, are built for some off-road use, and have a wheelbase of 110 inches or less. A long-wheelbase crossover is not required to carry the label. On a shorter off-road SUV, flip the visor and check both sides. A missing or painted-over label hints at how the vehicle was handled.
Mileage and records: what the VIN adds to a rating
A rollover percentage describes a design as tested. The used SUV or sedan in front of you has also lived through years of driving, and a vehicle-record check reads that history. Begin with the odometer. Dated readings in order show how long the brakes, tires and stability sensors have been working, and a reading that steps backward means the dash number cannot be trusted.
- Odometer readings: the mileage sequence behind the dash number, and whether it only climbs.
- Accident and damage records: a good rating says nothing about a car that has already been in a serious crash.
- Salvage and auction history with photos: damage shown before any repair.
- Title brands and open recalls: restraint and stability systems turn up often in recalls.
- Factory specs: the body type and build the VIN decodes to.
UsedVehicleChecks opens with a free preview from the VIN. The full report is a single purchase, no subscription, and it earns its cost once a car is a serious candidate.
A short list to run on both cars before you pay
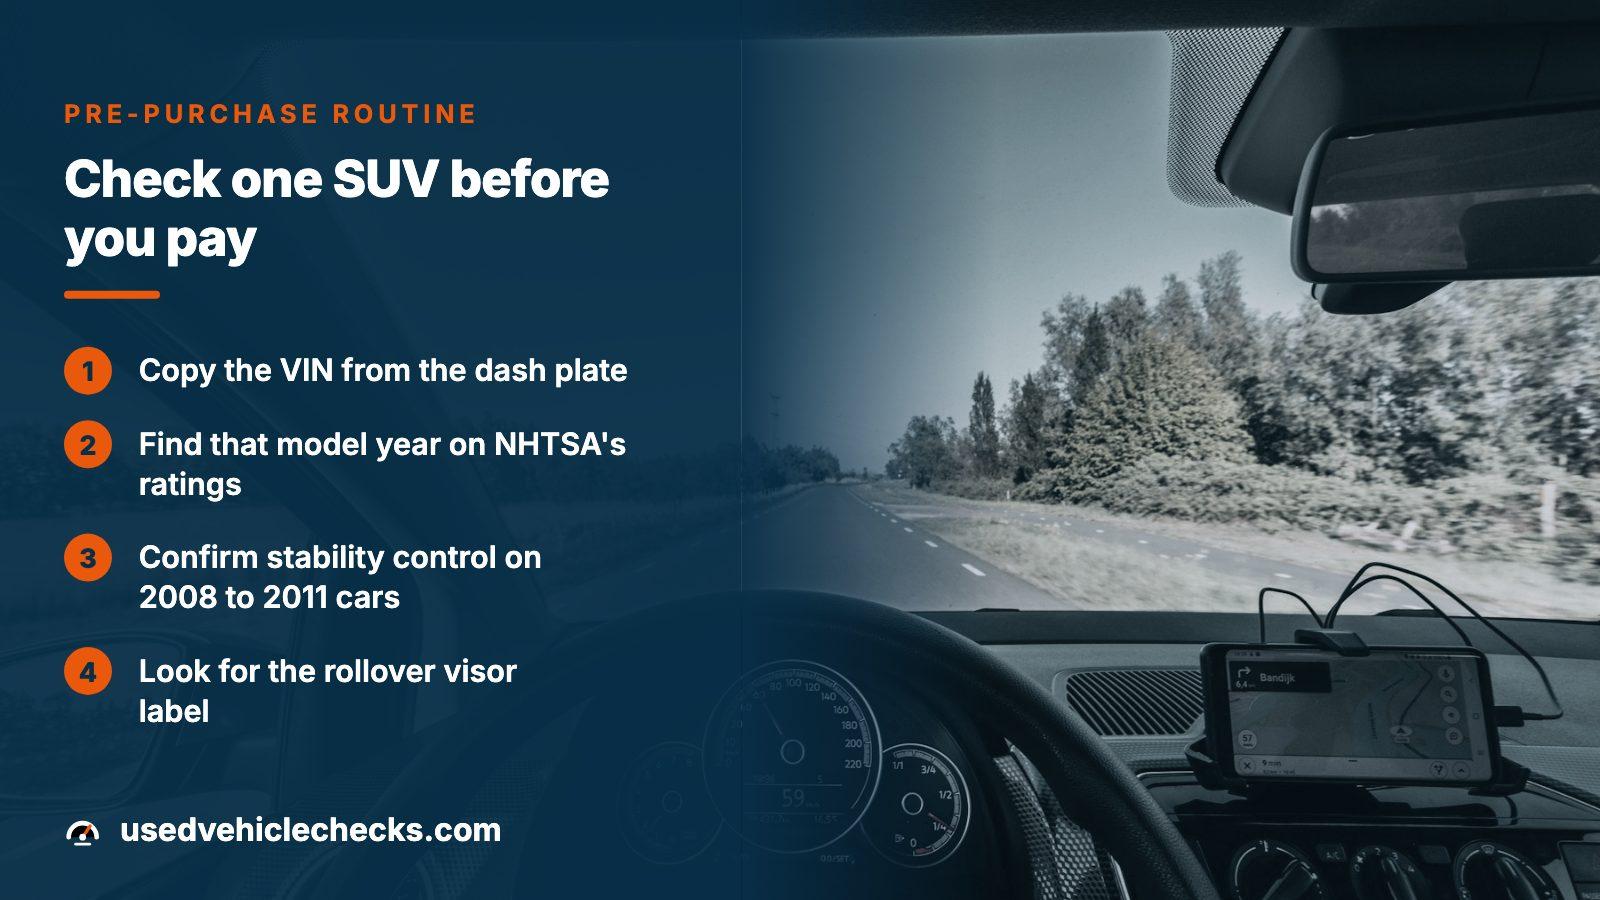
- Copy the VIN from the plate on the dash and from the sticker in the door opening, then confirm both match the listing and the title.
- Find that precise model year and nameplate on NHTSA's ratings site and note the rollover percentage and stars. Ratings are tied to a body configuration, so a trim can differ.
- If the car was built from 2008 to 2011, confirm stability control is fitted, then read that model year's complaints for reports that the system itself fails.
- On a short-wheelbase SUV, look for the rollover label on the sun visor.
- Put the VIN through NHTSA's recall lookup. The search costs nothing, and a recall repair is free to the owner.
- Open the VIN preview, then the report if the car stays in the running, and read the odometer readings first, then the accident and salvage records.
Unrated is not the same as safe
An older car with no NHTSA rating was never tested. Count that as unknown, then let its condition and its records decide.
Where this information comes from
- NHTSA: 5-Star Safety Ratings — Where the rollover percentage and star result are published for each year, make and model.
- 49 CFR 575.105: vehicle rollover consumer information — The sun-visor warning label and the wheelbase-based definition of a utility vehicle.
- 49 CFR 571.126: FMVSS 126, electronic stability control — The purpose statement, the 10,000-pound scope and the phase-in dates for stability control.
- NHTSA: recall lookup by VIN — Open recall campaigns for a specific vehicle, at no charge.
Sources and photos: Facts checked against the sources above in November 2026. Photos by Will Truettner, Sander Jeurissen and engin akyurt on Unsplash; diagrams by UsedVehicleChecks.
Keep reading
- Odometer Reading: How to Read It, Write It Down and Test ItThe dash number and the dated readings behind it, which this page leans on.
- How Many Miles Is Too Many on a Used Car? Age, Pace and ProofMileage is the other number buyers weigh wrongly when sizing up a car.
- How to Buy a Used Car: Start With the Mileage, Then the RecordsWhere the safety question fits in the whole used-car purchase.
- Toyota 4Runner Years to Avoid: Read the Year, Then the MileageA model-level look at one popular SUV, year by year.
Frequently asked questions
Are SUVs safer than sedans?
Not for tipping over: in the sample on this page the SUV median rollover chance is higher than the sedan median. Not for every crash either, since extra weight helps when a heavy vehicle meets a light one. The honest answer changes with the accident, so judge the specific used car by its own rating, equipment and records.
What does NHTSA's rollover percentage actually measure?
The likelihood that a vehicle tips over when it crashes alone. It is published as a percentage and as stars, and it reflects a vehicle's proportions more than its structure. It is not a death rate and it ignores collisions between two vehicles, so treat it as one input among several.
Does stability control close the rollover gap?
It narrows it. The system acts on the loss of control that comes before many rollovers, but it cannot lower a vehicle's center of gravity. On a used car, check that it is fitted, especially if the build falls in the 2008 to 2011 phase-in, because the model year alone does not tell you.
Should I avoid SUVs when buying used?
No. The data says one risk runs higher and is rated for each vehicle, so you can compare the two cars you are really considering. Within SUVs alone the sample runs from 13.5% to 27.9%, so which SUV you pick matters a lot. Decide on the rating, the equipment and the history.
How do I look up the rollover rating on one used car?
Use NHTSA's 5-Star ratings site and search by model year, make and model. The rating belongs to a body configuration, so match the body style to the one on the lot. Older vehicles often have no rating at all, which means they were never tested, not that they failed.
Now check the car itself
The guide explains what to look for. The report shows what this VIN has on record.