THE SHORT ANSWER
For 2024, the Federal Highway Administration reports an average of 10,812 miles per vehicle for light duty vehicles on shorter frames of up to 121 inches, and 10,707 for longer ones. Taken together, light duty vehicles averaged 10,787. The number shifts by a few hundred miles from one year to the next, and no individual car is obliged to follow it.
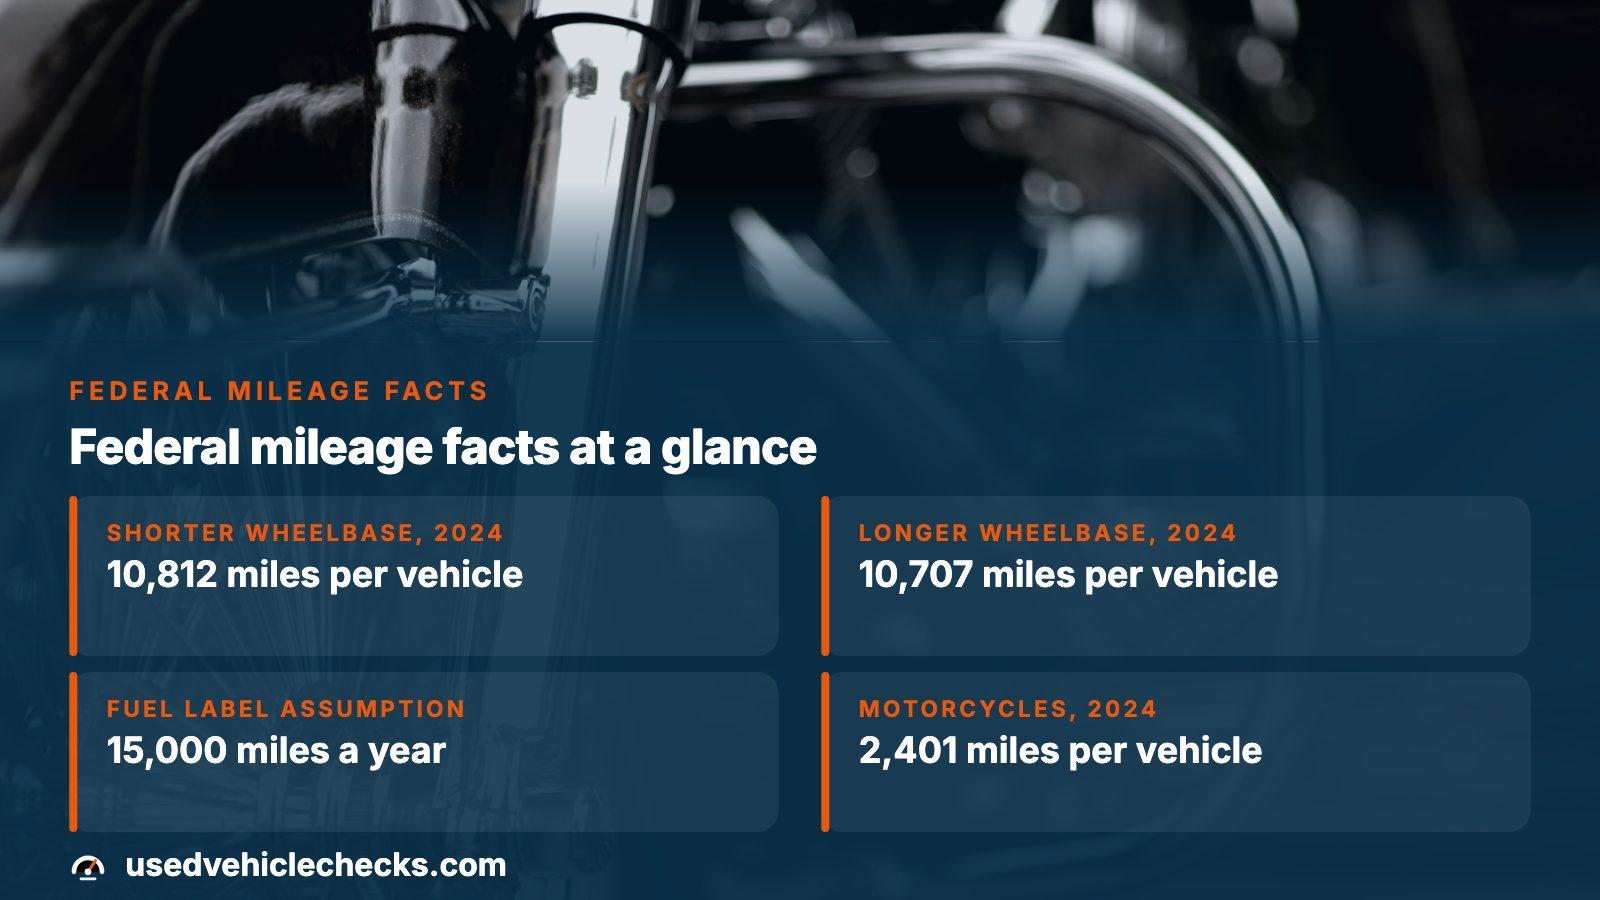
- Shorter wheelbase, 2024
- 10,812 miles per vehicle
- Longer wheelbase, 2024
- 10,707 miles per vehicle
- Fuel label assumption
- 15,000 miles a year
- Motorcycles, 2024
- 2,401 miles per vehicle
The headline number and where it comes from
The figure most people quote traces back to Table VM-1 in the Federal Highway Administration's Highway Statistics series. The agency takes the total vehicle-miles driven by a class of vehicle, divides by the number of those vehicles registered, and publishes the result as miles per vehicle.
For passenger cars, SUVs, vans and light pickups on the shorter frames (up to 121 inches between the axles), the 2024 result is 10,812 miles. Longer-wheelbase light vehicles, which includes the bigger pickups and vans, came out at 10,707. Pool both groups and the average is 10,787. At UsedVehicleChecks the odometer is where every used-car review begins, and this is the benchmark we hold it against.
Three years of the same statistic
One year can mislead, so it helps to see the series. The 2023 edition of the same table gives the 2022 and 2023 figures for the shorter-wheelbase group, which lets us line up three years.
| Year | Shorter wheelbase | Longer wheelbase |
|---|---|---|
| 2022 | 10,881 | 11,177 |
| 2023 | 11,026 | 11,360 |
| 2024 | 10,812 | 10,707 |
The swing is a few hundred miles, and the longer-wheelbase group moved more than the shorter one. A seller who claims a steady round-number pace every year is describing a habit, not a national norm, and you are free to ask what the habit was based on.
Why popular estimates run higher
Plenty of articles quote a rounder, higher number. The 15,000 has a traceable origin: the five-year running-cost estimate on a window-label for a new vehicle is calculated as if the car were driven that far each year. It is a convention chosen so that two cars can be compared on the same footing, and FuelEconomy.gov presents it that way.
Federal averages also mix every owner together: commuters, retirees, a second car used for errands, a fleet vehicle. A buyer shopping for a particular car should care less about the mean and more about the spread around it.
Read the figure as a range
Think of the national number as the middle of a wide band. Light drivers sit far below it and delivery or sales drivers far above, so a reading that differs from the average is a question to ask, not a defect.
Other vehicle types keep very different pace
The same table breaks out vehicles that follow nothing like the car average. If the vehicle you are weighing is not an ordinary car or SUV, borrow the right row instead.
- Motorcycles averaged 2,401 miles per vehicle in 2024, which is why a motorcycle with five-figure miles on a short ownership deserves a second look.
- Single-unit trucks averaged 10,880 and buses 16,494.
- Combination trucks, the tractor-trailer class, averaged 55,276.
- All motor vehicles taken together came to 11,071 across 297,525,836 registrations.
Turning the average into a buying test
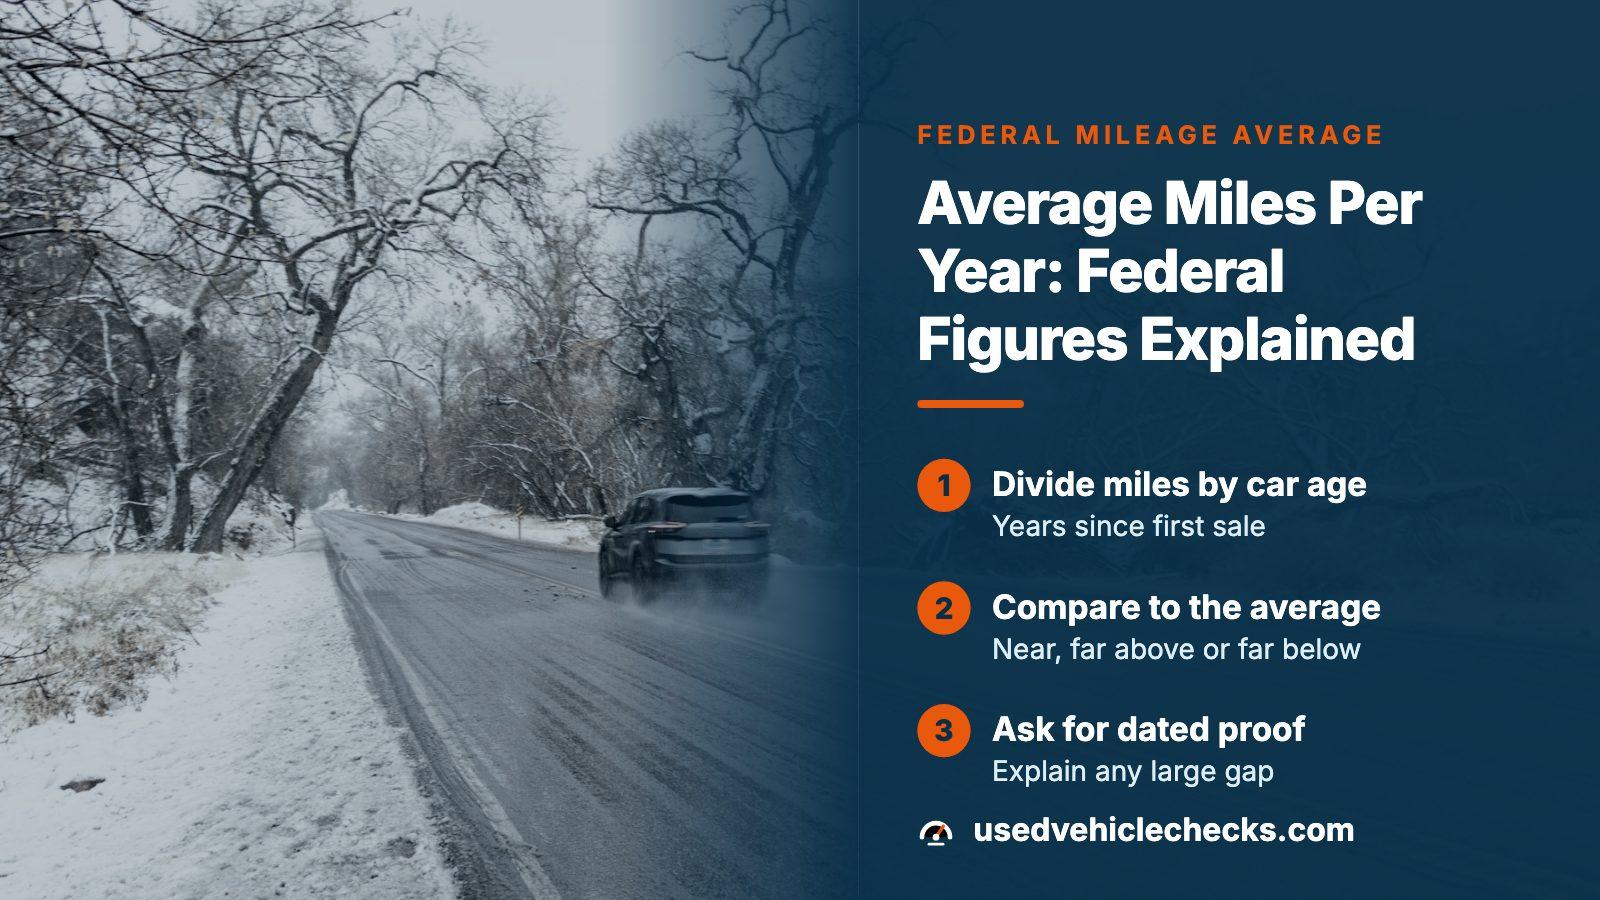
The arithmetic is short. Take the odometer reading, divide by the car's age in years, and compare the answer with the national figure of 10,812. The model year is a fair stand-in for age, though a car built late in the year and first sold the next spring may have a little less time on the clock than the number suggests.
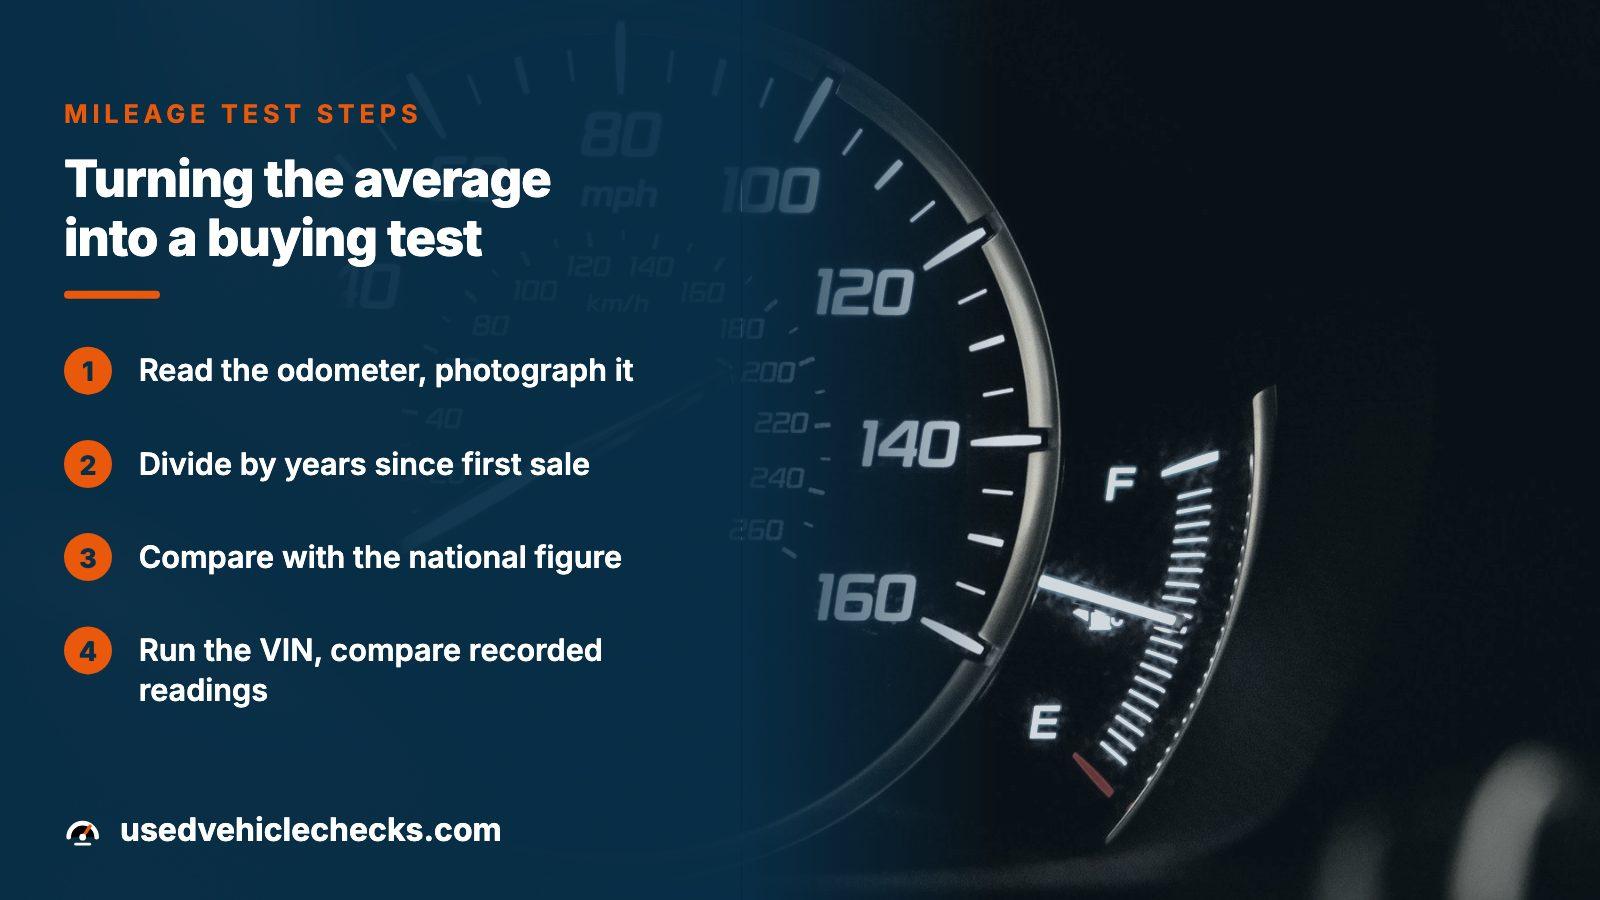
- Read the odometer in person and photograph it.
- Divide by the years since the car was first sold.
- Note whether the result is near, far above or far below the national figure.
- Ask the seller to explain any large gap, then ask for dated paper that supports the explanation.
- Run the VIN and compare the recorded readings with the dash.
A high pace is usually honest wear that should show up in the price. A very low pace is the one that needs proof, because a low reading is what makes a used car expensive.
When a records check takes over from the average
An average can only tell you what is typical, so it cannot tell you whether a particular dash is honest. That job belongs to the readings recorded at past title transfers, inspections and auctions. A VIN-based report lists them in date order, and the useful test is whether any reading steps backward compared with its predecessor.
NMVTIS, the federal title database, was set up as a consumer safeguard, with stolen-vehicle resale among the problems it targets. UsedVehicleChecks lets you run a VIN for a free preview first, with the full report a single payment afterward; the pricing page lays out the options.
Why very old cars have thinner mileage records
Federal rules require the seller to state the mileage in writing when a vehicle changes hands, but they carve out exceptions. Under 49 CFR 580.17, no disclosure is needed for vehicles over 16,000 pounds gross weight or for vehicles that are not self-propelled.
Age exempts cars too: a model year 2010 or older car is exempt once ten years have passed since January 1 of its model-year calendar year, and a 2011 or newer one after twenty years. The rule's own example says transfers in calendar year 2031 are exempt for a 2011 or older model. For an older car the average is a weaker guide, and the history behind the reading counts for more.
Where this information comes from
- FHWA: Highway Statistics 2024, Table VM-1 — Where the 2024 per-vehicle averages, the wheelbase definition and the vehicle-type rows come from.
- FHWA: Highway Statistics 2023, Table VM-1 — Supplies the 2022 and 2023 figures used for the three-year comparison.
- FuelEconomy.gov: gasoline fuel economy label — Shows that the label's five-year cost comparison assumes a set annual distance.
- eCFR: 49 CFR 580.17 disclosure exemptions — Lists the vehicles and ages exempt from written mileage disclosure.
- VehicleHistory.gov: NMVTIS — Describes the federal title database and its consumer-protection purpose.
Sources and photos: Facts checked against the sources above in November 2026. Photos by Zoshua Colah, NATHAN MULLET and Steve Smith on Unsplash; diagrams by UsedVehicleChecks.
Keep reading
- How Many Miles Is Too Many on a Used Car? Age, Pace and ProofApplies the pace to a car's age and the price it should carry.
- Mileage Check by VIN: What the Recorded Odometer Readings ShowShows how recorded readings are listed and compared.
- Is Low Mileage on an Old Car Good? What the Number Can HideFor the case where the dash reads far below the pace.
- Odometer Exempt Vehicles: Which Cars Need No Mileage StatementWhich vehicles need no written mileage statement at sale.
Frequently asked questions
How many miles per year is normal for a car?
Federal data for 2024 shows 10,812 miles per vehicle for cars, SUVs, vans and light pickups with shorter wheelbases. Individual drivers vary widely, so use it as a middle point. A commuter will beat it comfortably and a weekend car will fall far short, and neither pattern is wrong.
Is 15,000 miles a year the average?
No. The 15,000 figure is the assumption behind the five-year cost estimate on a new vehicle's label, chosen to compare vehicles on equal terms. The Federal Highway Administration's measured average for the same vehicles is lower, at 10,812 in 2024, so a car near 15,000 a year was driven harder than most.
Does the average change every year?
Yes, by a few hundred miles. The shorter-wheelbase figure was 10,881 for 2022, 11,026 for 2023 and 10,812 for 2024. Those are national estimates built from state highway, fuel and registration data, so small moves reflect modeling and economic conditions as much as changes in anyone's driving.
What if a used car has far fewer miles than average?
Treat it as a claim to test. Ask for dated service invoices, inspection records or past sale paperwork, and compare them with the readings recorded against the VIN. Genuine low use is real and leaves evidence. A low number that nothing in the record supports is the one that deserves caution.
Does the average apply to motorcycles and trucks?
Not at all. The 2024 table gives motorcycles 2,401 miles per vehicle, single-unit trucks 10,880, buses 16,494 and combination trucks 55,276. Compare a vehicle against its own class rather than the car figure, or the comparison will mislead you in one direction or the other.
Now check the car itself
The guide explains what to look for. The report shows what this VIN has on record.